AlphaAI-powered, coming soon
See every real visit.
Open-source, self-hostable frontend monitoring.
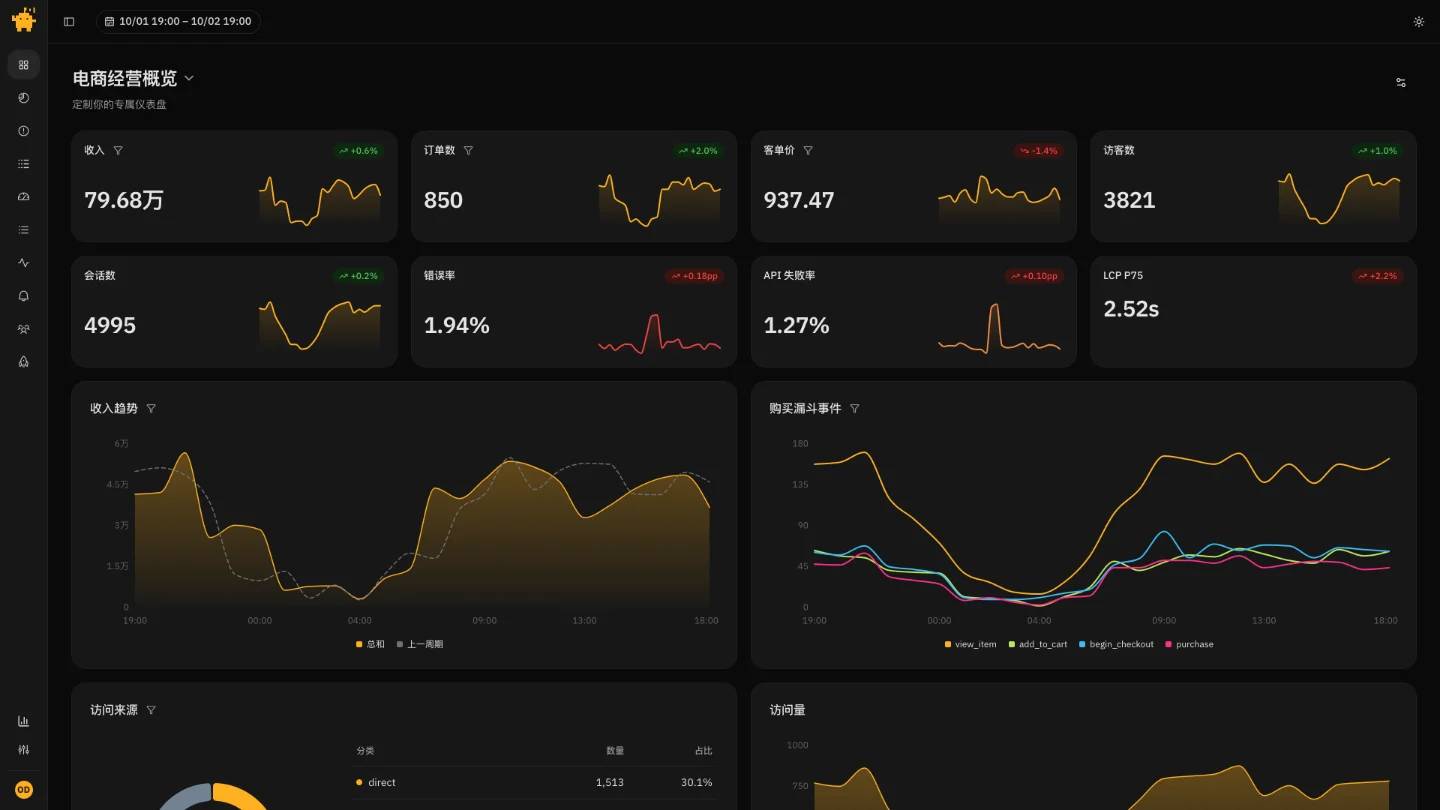
Your whole frontend, in one console.
What broke, and who it hit.
How fast pages are, and where they slow down.
What users actually went through.
Every log line, tied to its session.
Hear about it before your users do.
Your numbers, arranged your way.
Architecture and performance
Built for heavy writes. Queries still come back fast.
- Browser SDKCapture
- IngestReceive
- KafkaBuffer
- ConsumerBatch write
- ClickHouseColumnar storage
- APIQuery
- ConsoleExplore
- events/s
- 2,000
- Ingest P95
- 50 ms
- Query P95
- 685 ms
- Nothing droppedKafka absorbs the peaks
- Fast queriesPre-aggregated with materialized views
- Spike protectionPer-project rate limits stop surges at the door, so the whole service stays up
- Storage protectionSampling tightens as the disk fills, so ingestion never runs the database out of space
Synthetic load on one machine, not a production certification.See the method
FAQ
What servers do I need?
Any machine with Docker is enough to start. For production, deploy with Docker or Kubernetes.
Which platforms are supported?
Web browsers today, plus a Vite plugin that uploads Source Maps.
Does my data go to a third party?
No. Everything is written to the databases you deploy.
Will it slow my pages down?
The SDK reports in the background, and you can sample a share of traffic.
Is it ready for production?
It's in Alpha, which suits pilots and internal projects.
Make it better, together.
OpenRUM is built in the open. Issues, docs and code are all welcome.